الجمعة، 22 مارس 2013

Propagation of an Electromagnetic Wave

Electromagnetic waves are waves which can travel through the vacuum of outer space. Mechanical waves, unlike electromagnetic waves, require the presence of a material medium in order to transport their energy from one location to another. Sound waves are examples of mechanical waves while light waves are examples of electromagnetic waves.
Electromagnetic waves are created by the vibration of an electric charge. This vibration creates a wave which has both an electric and a magnetic component. An electromagnetic wave transports its energy through a vacuum at a speed of 3.00 x 10⁸ m/s (a speed value commonly represented by the symbol c). The propagation of an electromagnetic wave through a material medium occurs at a net speed which is less than 3.00 x 10⁸ m/s. This is depicted in the animation below.
The mechanism of energy transport through a medium involves the absorption and reemission of the wave energy by the atoms of the material. When an electromagnetic wave impinges upon the atoms of a material, the energy of that wave is absorbed. The absorption of energy causes the electrons within the atoms to undergo vibrations. After a short period of vibrational motion, the vibrating electrons create a new electromagnetic wave with the same frequency as the first electromagnetic wave. While these vibrations occur for only a very short time, they delay the motion of the wave through the medium. Once the energy of the electromagnetic wave is reemitted by an atom, it travels through a small region of space between atoms. Once it reaches the next atom, the electromagnetic wave is absorbed, transformed into electron vibrations and then reemitted as an electromagnetic wave. While the electromagnetic wave will travel at a speed of c (3 x 10⁸ m/s) through the vacuum of interatomic space, the absorption and reemission process causes the net speed of the electromagnetic wave to be less than c. This is observed in the animation below.
The actual speed of an electromagnetic wave through a material medium is dependent upon the optical density of that medium. Different materials cause a different amount of delay due to the absorption and reemission process. Furthermore, different materials have their atoms more closely packed and thus the amount of distance between atoms is less. These two factors are dependent upon the nature of the material through which the electromagnetic wave is traveling. As a result, the speed of an electromagnetic wave is dependent upon the material through which it is traveling.

Sound Waves and the Eardrum

A sound wave traveling through a fluid medium (such as a liquid or a gaseous material) has a longitudinal nature. This means that the particles of the medium vibrate in direction which is parallel (and anti-parallel) to the direction which the sound wave travels. If the sound wave travels from west to east, then the particles of the medium vibrate back and forth along the east-west axis. As a sound wave impinges upon a particle of air, that particle is temporarily disturbed from its rest position. This particle in turn pushes upon its nearest neighbor, causing it to be displaced from its rest position. The displacement of several nearby particles produces a region of space in which several particles are compressed together. Such a region is known as a compression or high pressure region. A restoring force typically pulls each particle back towards its original rest position. As the particles are pulled away from each other, a region is created in which the particles are spread apart. Such a region is known as a rarefaction or low pressure region. Because a sound wave consists of an alternating pattern of high pressure (compressions) and low pressure (rarefactions) regions traveling through the medium, it is known as a pressure wave.
When a pressure wave reaches the ear, a series of high and low pressure regions impinge upon the eardrum. The arrival of a compression or high pressure region pushes the eardrum inward; the arrival of a low pressure regions serves to pull the eardrum outward. The continuous arrival of high and low pressure regions sets the eardrum into vibrational motion. This is depicted in the animation below.
The eardrum is attached to the bones of the middle ear - the hammer, anvil, and stirrup. As these bones begin vibrating, the sound signal is transformed from a pressure wave traveling through air to the mechanical vibrations of the bone structure of the middle ear. These vibrations are then transmitted to the fluid of the inner ear where they are converted to electrical nerve impulses which are sent to the brain.
Since the eardrum is set into vibration by the incoming pressure wave, the vibrations occur at the same frequency as the pressure wave. If the incoming compressions and rarefactions arrive more frequently, then the eardrum vibrates more frequently. This frequency is transmitted through the middle and inner ear and provides the perception of pitch. Higher frequency vibrations are perceived as higher pitch sounds and lower frequency vibrations are perceived as lower pitch sounds.
The intensity of the incoming sound wave can also be transmitted through the middle ear to the inner ear and interpreted by the brain. A high intensity sound wave is characterized by vibrations of air particles with a high amplitude. When these high amplitude vibrations impinge upon the eardrum, they produce a very forceful displacement of the eardrum from its rest position. This high intensity sound wave causes a large vibration of the eardrum and subsequently a large and forceful vibration of the bones of the middle ear. This high amplitude vibration is transmitted to the fluid of the inner ear and encoded in the nerve signal which is sent to the brain. A high intensity sound is perceived as a relatively loud sound by the brain.

Longitudinal Waves and Guitar Strings

A sound wave is produced by a vibrating object. As a guitar string vibrates, it sets surrounding air molecules into vibrational motion. The frequency at which these air molecules vibrate is equal to the frequency of vibration of the guitar string. The back and forth vibrations of the surrounding air molecules creates a pressure wave which travels outward from its source. This pressure wave consists of compressions and rarefactions. The compressions are regions of high pressure, where the air molecules are compressed into a small region of space. The rarefactions are regions of low pressure, where the air molecules are spread apart. This alternating pattern of compressions and rarefactions is known as a sound wave.
In solids, sound can exist as either a longitudinal or a transverse wave. But in mediums which are fluid (e.g., gases and liquids), sound waves can only be longitudinal. The animation above depicts a sound wave as a longitudinal wave. In a longitudinal wave, particles of the medium vibrate back and forth in a direction which is parallel (and anti-parallel) to the direction of energy transport. In the animation above, the energy is shown traveling outward from the guitar string - from left to right. A careful inspection of the particles of the medium (represented by lines) in the animation above reveal that the particles of the medium are displaced rightward and then move back leftward to their original position. There is no net displacement of the air molecules. The molecules of air are only temporarily disturbed from their rest position; they always return to their original position. In this sense, a sound wave (like any wave) is a phenomenon which transports energy from one location to another without transporting matter.
A guitar string vibrating by itself does not produce a very loud sound. The string itself disturbs very little air since its small surface area makes very little contact with surrounding air molecules. However, if the guitar string is attached to a larger object, such as a wooden sound box, then more air is disturbed. The guitar string forces the sound box to begin vibrating at the same frequency as the string. The sound box in turn forces surrounding air molecules into vibrational motion. Because of the large surface area of the sound box, more air molecules are set into vibrational motion. This produces a more audible sound.

Longitudinal Waves and Tuning Forks

Sound waves are produced by vibrating objects. Whether it be the sound of a person's voice, the sound of a piano, the sound of a trombone or the sound of a physics book slamming to the floor, the source of the sound is always a vibrating object.
A tuning fork serves as a useful illustration of how a vibrating object can produce sound. The fork consists of a handle and two tines. When the tuning fork is hit with a rubber hammer, the tines begin to vibrate. The back and forth vibration of the tines produce disturbances of surrounding air molecules. As a tine stretches outward from its usual position, it compresses surrounding air molecules into a small region of space; this creates a high pressure region next to the tine. As the tine then moves inward from its usual position, air surrounding the tine expands; this produces a low pressure region next to the tine. The high pressure regions are known as compressions and the low pressure regions are known as rarefactions. As the tines continue to vibrate, an alternating pattern of high and low pressure regions are created. These regions are transported through the surrounding air, carrying the sound signal from one location to another.
In solids, sound can exist as either a longitudinal or a transverse wave. But in mediums which are fluid (e.g., gases and liquids), sound waves can only be longitudinal. The animation above depicts a sound wave as a longitudinal wave. In a longitudinal wave, particles of the medium vibrate back and forth in a direction which is parallel (and anti-parallel) to the direction of energy transport. In the animation above, the energy is shown traveling outward from the tuning fork - from left to right. The air molecules are vibrating about a fixed position from left to right and from right to left. This is what makes a sound wave a longitudinal wave.
There is another important characteristic of waves depicted in the animation above. A careful inspection of the particles of the air (represented by dots) reveal that the air molecules are nudged rightward and then move back leftward to their original position. Air molecules are continuously vibrating back and forth about their original position. There is no net displacement of the air molecules. The molecules of air are only temporarily disturbed from their rest position; they always return to their original position. In this sense, a sound wave (like any wave) is a phenomenon which transports energy from one location to another without transporting matter.

Longitudinal Wave

A wave is a disturbance of a medium which transports energy through the medium without permanently transporting matter. In a wave, particles of the medium are temporarily displaced and then return to their original position. There are a variety of ways to categorize waves. One way to categorize waves is to say that there are longitudinal and transverse waves. In a transverse wave, particles of the medium are displaced in a direction perpendicular to the direction of energy transport. In a longitudinal wave, particles of the medium are displaced in a direction parallel to energy transport. The animation below depicts a longitudinal pulse in a medium.
The animation portrays a medium as a series of particles connected by springs. As one individual particle is disturbed, it transmits the disturbance to the next interconnected particle. This disturbance continues to be passed on to the next particle. The result is that energy is transported from one end of the medium to the other end of the medium without the actual transport of matter. In this type of wave - a longitudinal wave - the particles of the medium vibrate in a direction parallel to the direction of energy transport.

Pendulum Motion

A simple pendulum consists of a relatively massive object hung by a string from a fixed support. It typically hangs vertically in its equilibrium position. The massive object is affectionately referred to as the pendulum bob. When the bob is displaced from equilibrium and then released, it begins its back and forth vibration about its fixed equilibrium position. The motion is regular and repeating, an example of periodic motion.

we learned that an object that is vibrating is acted upon by a restoring force. The restoring force causes the vibrating object to slow down as it moves away from the equilibrium position and to speed up as it approaches the equilibrium position. It is this restoring force that is responsible for the vibration. So what forces act upon a pendulum bob? And what is the restoring force for a pendulum? There are two dominant forces acting upon a pendulum bob at all times during the course of its motion. There is the force of gravity that acts downward upon the bob. It results from the Earth's mass attracting the mass of the bob. And there is a tension force acting upward and towards the pivot point of the pendulum. The tension force results from the string pulling upon the bob of the pendulum. In our discussion, we will ignore the influence of air resistance - a third force that always opposes the motion of the bob as it swings to and fro. The air resistance force is relatively weak compared to the two dominant forces.
The gravity force is highly predictable; it is always in the same direction (down) and always of the same magnitude - mass*9.8 N/kg. The tension force is considerably less predictable. Both its direction and its magnitude change as the bob swings to and fro. The direction of the tension force is always towards the pivot point. So as the bob swings to the left of its equilibrium position, the tension force is at an angle - directed upwards and to the right. And as the bob swings to the right of its equilibrium position, the tension is directed upwards and to the left. The diagram below depicts the direction of these two forces at five different positions over the course of the pendulum's path.
In physical situations in which the forces acting on an object are not in the same, opposite or perpendicular directions, it is customary to resolve one or more of the forces into components. This was the practice used in the analysis of sign hanging problems and inclined plane problems. Typically one or more of the forces are resolved into perpendicular components that lie along coordinate axes that are directed in the direction of the acceleration or perpendicular to it. So in the case of a pendulum, it is the gravity force which gets resolved since the tension force is already directed perpendicular to the motion. The diagram at the right shows the pendulum bob at a position to the right of its equilibrium position and midway to the point of maximum displacement. A coordinate axis system is sketched on the diagram and the force of gravity is resolved into two components that lie along these axes. One of the components is directed tangent to the circular arc along which the pendulum bob moves; this component is labeled Fgrav-tangent. The other component is directed perpendicular to the arc; it is labeled Fgrav-perp. You will notice that the perpendicular component of gravity is in the opposite direction of the tension force. You might also notice that the tension force is slightly larger than this component of gravity. The fact that the tension force (Ftens) is greater than the perpendicular component of gravity (Fgrav-perp) means there will be a net force which is perpendicular to the arc of the bob's motion. This must be the case since we expect that objects that move along circular paths will experience an inward or centripetal force. The tangential component of gravity (Fgrav-tangent) is unbalanced by any other force. So there is a net force directed along the other coordinate axes. It is this tangential component of gravity which acts as the restoring force. As the pendulum bob moves to the right of the equilibrium position, this force component is directed opposite its motion back towards the equilibrium position.
The above analysis applies for a single location along the pendulum's arc. At the other locations along the arc, the strength of the tension force will vary. Yet the process of resolving gravity into two components along axes that are perpendicular and tangent to the arc remains the same. The diagram below shows the results of the force analysis for several other positions.
There are a couple comments to be made. First, observe the diagram for when the bob is displaced to its maximum displacement to the right of the equilibrium position. This is the position in which the pendulum bob momentarily has a velocity of 0 m/s and is changing its direction. The tension force (Ftens) and the perpendicular component of gravity (Fgrav-perp) balance each other. At this instant in time, there is no net force directed along the axis that is perpendicular to the motion. Since the motion of the object is momentarily paused, there is no need for a centripetal force.
Second, observe the diagram for when the bob is at the equilibrium position (the string is completely vertical). When at this position, there is no component of force along the tangent direction. When moving through the equilibrium position, the restoring force is momentarily absent. Having been restored to the equilibrium position, there is no restoring force. The restoring force is only needed when the pendulum bob has been displaced away from the equilibrium position. You might also notice that the tension force (Ftens) is greater than the perpendicular component of gravity (Fgrav-perp) when the bob moves through this equilibrium position. Since the bob is in motion along a circular arc, there must be a net centripetal force at this position.

The Sinusoidal Nature of Pendulum Motion
In the previous part of this lesson, we investigated the sinusoidal nature of the motion of a mass on a spring. We will conduct a similar investigation here for the motion of a pendulum bob. Let's suppose that we could measure the amount that the pendulum bob is displaced to the left or to the right of its equilibrium or rest position over the course of time. A displacement to the right of the equilibrium position would be regarded as a positive displacement; and a displacement to the left would be regarded as a negative displacement. Using this reference frame, the equilibrium position would be regarded as the zero position. And suppose that we constructed a plot showing the variation in position with respect to time. The resulting position vs. time plot is shown below. Similar to what was observed for the mass on a spring, the position of the pendulum bob (measured along the arc relative to its rest position) is a function of the sine of the time.
Now suppose that we use our motion detector to investigate the how the velocity of the pendulum changes with respect to the time. As the pendulum bob does the back and forth, the velocity is continuously changing. There will be times at which the velocity is a negative value (for moving leftward) and other times at which it will be a positive value (for moving rightward). And of course there will be moments in time at which the velocity is 0 m/s. If the variations in velocity over the course of time were plotted, the resulting graph would resemble the one shown below.
Now let's try to understand the relationship between the position of the bob along the arc of its motion and the velocity with which it moves. Suppose we identify several locations along the arc and then relate these positions to the velocity of the pendulum bob. The graphic below shows an effort to make such a connection between position and velocity.
As is often said, a picture is worth a thousand words. Now here come the words. The plot above is based upon the equilibrium position (D) being designated as the zero position. A displacement to the left of the equilibrium position is regarded as a negative position. A displacement to the right is regarded as a positive position. An analysis of the plots shows that the velocity is least when the displacement is greatest. And the velocity is greatest when the displacement of the bob is least. The further the bob has moved away from the equilibrium position, the slower it moves; and the closer the bob is to the equilibrium position, the faster it moves. This can be explained by the fact that as the bob moves away from the equilibrium position, there is a restoring force that opposes its motion. This force slows the bob down. So as the bob moves leftward from position D to E to F to G, the force and acceleration is directed rightward and the velocity decreases as it moves along the arc from D to G. At G - the maximum displacement to the left - the pendulum bob has a velocity of 0 m/s. You might think of the bob as being momentarily paused and ready to change its direction. Next the bob moves rightward along the arc from G to F to E to D. As it does, the restoring force is directed to the right in the same direction as the bob is moving. This force will accelerate the bob, giving it a maximum speed at position D - the equilibrium position. As the bob moves past position D, it is moving rightward along the arc towards C, then B and then A. As it does, there is a leftward restoring force opposing its motion and causing it to slow down. So as the displacement increases from D to A, the speed decreases due to the opposing force. Once the bob reaches position A - the maximum displacement to the right - it has attained a velocity of 0 m/s. Once again, the bob's velocity is least when the displacement is greatest. The bob completes its cycle, moving leftward from A to B to C to D. Along this arc from A to D, the restoring force is in the direction of the motion, thus speeding the bob up. So it would be logical to conclude that as the position decreases (along the arc from A to D), the velocity increases. Once at position D, the bob will have a zero displacement and a maximum velocity. The velocity is greatest when the displacement is least. The animation at the right (used with the permission of Wikimedia Commons; special thanks to Hubert Christiaen) provides a visual depiction of these principles. The acceleration vector that is shown combines both the perpendicular and the tangential accelerations into a single vector. You will notice that this vector is entirely tangent to the arc when at maximum displacement; this is consistent with the force analysis discussed above. And the vector is vertical (towards the center of the arc) when at the equilibrium position. This also is consistent with the force analysis discussed above.
Energy Analysis
In a previous chapter of The Physics Classroom Tutorial, the energy possessed by a pendulum bob was discussed. We will expand on that discussion here as we make an effort to associate the motion characteristics described above with the concepts of kinetic energy, potential energy and total mechanical energy.
The kinetic energy possessed by an object is the energy it possesses due to its motion. It is a quantity that depends upon both mass and speed. The equation that relates kinetic energy (KE) to mass (m) and speed (v) is
KE = ½•m•v2
The faster an object moves, the more kinetic energy that it will possess. We can combine this concept with the discussion above about how speed changes during the course of motion. This blending of concepts would lead us to conclude that the kinetic energy of the pendulum bob increases as the bob approaches the equilibrium position. And the kinetic energy decreases as the bob moves further away from the equilibrium position.

The potential energy possessed by an object is the stored energy of position. Two types of potential energy are discussed in The Physics Classroom Tutorial - gravitational potential energy and elastic potential energy. Elastic potential energy is only present when a spring (or other elastic medium) is compressed or stretched. A simple pendulum does not consist of a spring. The form of potential energy possessed by a pendulum bob is gravitational potential energy. The amount of gravitational potential energy is dependent upon the mass (m) of the object and the height (h) of the object. The equation for gravitational potential energy (PE) is
PE = m•g•h
where g represents the gravitational field strength (sometimes referred to as the acceleration caused by gravity) and has the value of 9.8 N/kg.
The height of an object is expressed relative to some arbitrarily assigned zero level. In other words, the height must be measured as a vertical distance above some reference position. For a pendulum bob, it is customary to call the lowest position the reference position or the zero level. So when the bob is at the equilibrium position (the lowest position), its height is zero and its potential energy is 0 J. As the pendulum bob does the back and forth, there are times during which the bob is moving away from the equilibrium position. As it does, its height is increasing as it moves further and further away. It reaches a maximum height as it reaches the position of maximum displacement from the equilibrium position. As the bob moves towards its equilibrium position, it decreases its height and decreases its potential energy.
Now let's put these two concepts of kinetic energy and potential energy together as we consider the motion of a pendulum bob moving along the arc shown in the diagram at the right. We will use an energy bar chart to represent the changes in the two forms of energy. The amount of each form of energy is represented by a bar. The height of the bar is proportional to the amount of that form of energy. In addition to the potential energy (PE) bar and kinetic energy (KE) bar, there is a third bar labeled TME. The TME bar represents the total amount of mechanical energy possessed by the pendulum bob. The total mechanical energy is simply the sum of the two forms of energy – kinetic plus potential energy. Take some time to inspect the bar charts shown below for positions A, B, D, F and G. What do you notice?
When you inspect the bar charts, it is evident that as the bob moves from A to D, the kinetic energy is increasing and the potential energy is decreasing. However, the total amount of these two forms of energy is remaining constant. Whatever potential energy is lost in going from position A to position D appears as kinetic energy. There is a transformation of potential energy into kinetic energy as the bob moves from position A to position D. Yet the total mechanical energy remains constant. We would say that mechanical energy is conserved. As the bob moves past position D towards position G, the opposite is observed. Kinetic energy decreases as the bob moves rightward and (more importantly) upward toward position G. There is an increase in potential energy to accompany this decrease in kinetic energy. Energy is being transformed from kinetic form into potential form. Yet, as illustrated by the TME bar, the total amount of mechanical energy is conserved. This very principle of energy conservation was explained in the Energy chapter of The Physics Classroom Tutorial.

The Period of a Pendulum
Our final discussion will pertain to the period of the pendulum. As discussed previously in this lesson, the period is the time it takes for a vibrating object to complete its cycle. In the case of pendulum, it is the time for the pendulum to start at one extreme, travel to the opposite extreme, and then return to the original location. Here we will be interested in the question What variables affect the period of a pendulum? We will concern ourselves with possible variables. The variables are the mass of the pendulum bob, the length of the string on which it hangs, and the angular displacement. The angular displacement or arc angle is the angle that the string makes with the vertical when released from rest. These three variables and their effect on the period are easily studied and are often the focus of a physics lab in an introductory physics class. The data table below provides representative data for such a study.
Trial
Mass (kg)
Length (m)
Arc Angle (°)
Period (s)
1
0.02-
0.40
15.0
1.25
2
0.050
0.40
15.0
1.29
3
0.100
0.40
15.0
1.28
4
0.200
0.40
15.0
1.24
5
0.500
0.40
15.0
1.26
6
0.200
0.60
15.0
1.56
7
0.200
0.80
15.0
1.79
8
0.200
1.00
15.0
2.01
9
0.200
1.20
15.0
2.19
10
0.200
0.40
10.0
1.27
11
0.200
0.40
20.0
1.29
12
0.200
0.40
25.0
1.25
13
0.200
0.40
30.0
1.26
In trials 1 through 5, the mass of the bob was systematically altered while keeping the other quantities constant. By so doing, the experimenters were able to investigate the possible effect of the mass upon the period. As can be seen in these five trials, alterations in mass have little effect upon the period of the pendulum.
In trials 4 and 6-9, the mass is held constant at 0.200 kg and the arc angle is held constant at 15°. However, the length of the pendulum is varied. By so doing, the experimenters were able to investigate the possible effect of the length of the string upon the period. As can be seen in these five trials, alterations in length definitely have an effect upon the period of the pendulum. As the string is lengthened, the period of the pendulum is increased. There is a direct relationship between the period and the length.
Finally, the experimenters investigated the possible effect of the arc angle upon the period in trials 4 and 10-13. The mass is held constant at 0.200 kg and the string length is held constant at 0.400 m. As can be seen from these five trials, alterations in the arc angle have little to no effect upon the period of the pendulum.
So the conclusion from such an experiment is that the one variable that effects the period of the pendulum is the length of the string. Increases in the length lead to increases in the period. 
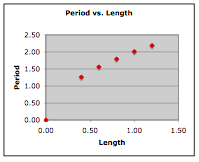
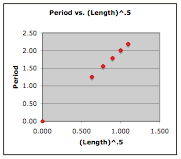
But the investigation doesn't have to stop there. The quantitative equation relating these variables can be determined if the data is plotted and linear regression analysis is performed. The two plots below represent such an analysis. In each plot, values of period (the dependent variable) are placed on the vertical axis. In the plot on the left, the length of the pendulum is placed on the horizontal axis. The shape of the curve indicates some sort of power relationship between period and length. In the plot on the right, the square root of the length of the pendulum (length to the ½ power) is plotted. The results of the regression analysis are shown.
Slope: 1.7536
Y-intercept: 0.2616
COR: 0.9183
Slope: 2.0045
Y-intercept: 0.0077
COR: 0.9999
The analysis shows that there is a better fit of the data and the regression line for the graph on the right. As such, the plot on the right is the basis for the equation relating the period and the length. For this data, the equation is
Period = 2.0045•Length0.5 + 0.0077
Using T as the symbol for period and L as the symbol for length, the equation can be rewritten as
T = 2.0045•L0.5 + 0.0077
The commonly reported equation based on theoretical development is
T = 2•π•(L/g)0.5
where g is a constant known as the gravitational field strength or the acceleration of gravity (9.8 N/kg). The value of 2.0045 from the experimental investigation agrees well with what would be expected from this theoretically reported equation. Substituting the value of g into this equation, yields a proportionality constant of 2π/g0.5, which is 2.0071, very similar to the 2.0045 proportionality constant developed in the experiment.

Properties of Periodic Motion

vibrating object is wiggling about a fixed position. Like the mass on a spring in the animation at the right, a vibrating object is moving over the same path over the course of time. Its motion repeats itself over and over again. If it were not for damping, the vibrations would endure forever (or at least until someone catches the mass and brings it to rest). The mass on the spring not only repeats the same motion, it does so in a regular fashion. The time it takes to complete one back and forth cycle is always the same amount of time. If it takes the mass 3.2 seconds for the mass to complete the first back and forth cycle, then it will take 3.2 seconds to complete the seventh back and forth cycle. It's like clockwork. It's so predictable that you could set your watch by it. In Physics, a motion that is regular and repeating is referred to as a periodic motion. Most objects that vibrate do so in a regular and repeated fashion; their vibrations are periodic. (Special thanks to Oleg Alexandrov for the animation of the mass on a spring. It is a public domain acquired from WikiMedia Commons. )
The Sinusoidal Nature of a Vibration
Suppose that a motion detector was placed below a vibrating mass on a spring in order to detect the changes in the mass's position over the course of time. And suppose that the data from the motion detector could represent the motion of the mass by a position vs. time plot. The graphic below depicts such a graph. For discussion sake, several points have been labeled on the graph to assist in the follow-up discussion.

Before reading on, take a moment to reflect on the type of information that is conveyed by the graph. And take a moment to reflect about what quantities on the graph might be important in understanding the mathematical description of a mass on a spring. If you've taken time to ponder these questions, the following discussion will likely be more meaningful.
One obvious characteristic of the graph has to do with its shape. Many students recognize the shape of this graph from experiences in Mathematics class. The graph has the shape of a sine wave. If y = sine(x) is plotted on a graphing calculator, a graph with this same shape would be created. The vertical axis of the above graph represents the position of the mass relative to the motion detector. A position of about 0.60 m cm above the detector represents the resting position of the mass. So the mass is vibrating back and forth about this fixed resting position over the course of time. There is something sinusoidal about the vibration of a mass on a spring. And the same can be said of a pendulum vibrating about a fixed position or of a guitar string or of the air inside of a wind instrument. The position of the mass is a function of the sine of the time.
A second obvious characteristic of the graph may be its periodic nature. The motion repeats itself in a regular fashion. Time is being plotted along the horizontal axis; so any measurement taken along this axis is a measurement of the time for something to happen. A full cycle of vibration might be thought of as the movement of the mass from its resting position (A) to its maximum height (B), back down past its resting position (C) to its minimum position (D), and then back to its resting position (E). Using measurements from along the time axis, it is possible to determine the time for one complete cycle. The mass is at position A at a time of 0.0 seconds and completes its cycle when it is at position E at a time of 2.3 seconds. It takes 2.3 seconds to complete the first full cycle of vibration. Now if the motion of this mass is periodic (i.e., regular and repeating), then it should take the same time of 2.3 seconds to complete any full cycle of vibration. The same time-axis measurements can be taken for the sixth full cycle of vibration. In the sixth full cycle, the mass moves from a resting position (U) up to V, back down past W to X and finally back up to its resting position (Y) in the time interval from 11.6 seconds to 13.9 seconds. This represents a time of 2.3 seconds to complete the sixth full cycle of vibration. The two cycle times are identical. Other cycle times are indicated in the table below. By inspection of the table, one can safely conclude that the motion of the mass on a spring is regular and repeating; it is clearly periodic. The small deviation from 2.3 s in the third cyle can be accounted for by the lack of precision in the reading of the graph.
Cycle
Letters
Times at Beginning and
End of Cycle (seconds)

Cycle Time
(seconds)

1st
A to E
0.0 sto 2.3 s
2.3
2nd
E tp I
2.3 s to 4.6 s
2.3
3rd
I to M
4.6 s to 7.0 s
2.4
4th
M to Q
7.0 s to 9.3 s
2.3
5th
Q to U
9.3 s to 11.6 s
2.3
6th
U to Y
11.6 s to 13.9 s
2.3

Students viewing the above graph will often describe the motion of the mass as "slowing down." It might be too early to talk in detail about what slowing down means. We will save the lengthy discussion of the topic for the page later in this lesson devoted to the motion of a mass on a spring. For now, let's simply say that over time, the mass is undergoing changes in its speed in a sinusoidal fashion. That is, the speed of the mass at any given moment in time is a function of the sine of the time. As such, the mass will both speed up and slow down over the course of a single cycle. So to say that the mass is "slowing down" is not entirely accurate since during every cycle there are two short intervals during which it speeds up. (More on this later.)
Students who describe the mass as slowing down (and most observant students do describe it this way) are clearly observing something in the graph features that draws out the "slowing down" comment. Before we discuss the feature that triggers the "slowing down" comment, we must re-iterate the conclusion from the previous paragraphs - the time to complete one cycle of vibration is NOT changing. It took 2.3 seconds to complete the first cycle and 2.3 seconds to complete the sixth cycle. Whatever "slowing down" means, we must refute the notion that it means that the cycles are taking longer as the motion continues. This notion is clearly contrary to the data.
A third obvious characteristic of the graph is that damping occurs with the mass-spring system. Some energy is being dissipated over the course of time. The extent to which the mass moves above (B, F, J, N, R and V) or below (D, H, L, P, T and X) the resting position (C, E, G, I, etc.) varies over the course of time. In the first full cycle of vibration being shown, the mass moves from its resting position (A) 0.60 m above the motion detector to a high position (B) of 0.99 m cm above the motion detector. This is a total upward displacement of 0.29 m. In the sixth full cycle of vibration that is shown, the mass moves from its resting position (U) 0.60 m above the motion detector to a high position (V) 0.94 m above the motion detector. This is a total upward displacement of 0.24 m cm. The table below summarizes displacement measurements for several other cycles displayed on the graph.
Cycle
Letters
Maximum Upward
Displacement
Maximum Downward
Displacement
1st
A to E
0.60 m to 0.99 m
0.60 m to 0.21 m
2nd
E to I
0.60 m to 0.98 m
0.60 m to 0.22 m
3rd
I to M
0.60 m to 0.97 m
0.60 m to 0.23 m
6th
U to Y
0.60 m to 0.94 m
0.60 m to 0.26 m
Over the course of time, the mass continues to vibrate - moving away from and back towards the original resting position. However, the amount of displacement of the mass at its maximum and minimum height is decreasing from one cycle to the next. This illustrates that energy is being lost from the mass-spring system. If given enough time, the vibration of the mass will eventually cease as its energy is dissipated.
Perhaps, this observation of energy dissipation or energy loss is the observation that triggers the "slowing down" comment discussed earlier. In physics (or at least in the English language), "slowing down" means to "get slower" or to "lose speed". Speed, a physics term, refers to how fast or how slow an object is moving. To say that the mass on the spring is "slowing down" over time is to say that its speed is decreasing over time. But as mentioned (and as will be discussed in great detail later), the mass speeds up during two intervals of every cycle. As the restoring force pulls the mass back towards its resting position (for instance, from B to C and from D to E), the mass speeds up. For this reason, a physicist adopts a different language to communicate the idea that the vibrations are "dying out". We use the phrase "energy is being dissipated or lost" instead of saying the "mass is slowing down." Language is important when it comes to learning physics. And sometimes, faulty language (combined with surface-level thinking) can confuse a student of physics who is sincerely trying to learn new ideas.

Period and Frequency
So far in this part of the lesson, we have looked at measurements of time and position of a mass on a spring. The measurements were based upon readings of a position-time graph. The data on the graph was collected by a motion detector that was capturing a history of the motion over the course of time. The key measurements that have been made are measurements of:
  • the time for the mass to complete a cycle, and
  • the maximum displacement of the mass above (or below) the resting position.
These two measurable quantities have names. We call these quantities period and amplitude.
An object that is in periodic motion - such as a mass on a spring, a pendulum or a bobblehead doll - will undergo back and forth vibrations about a fixed position in a regular and repeating fashion. The fact that the periodic motion is regular and repeating means that it can be mathematically described by a quantity known as the period. The period of the object's motion is defined as the time for the object to complete one full cycle. Being a time, the period is measured in units such as seconds, milliseconds, days or even years. The standard metric unit for period is the second.
An object in periodic motion can have a long period or a short period. For instance, a pendulum bob tied to a 1-meter length string has a period of about 2.0 seconds. For comparison sake, consider the vibrations of a piano string that plays the middle C note (the C note of the fourth octave). Its period is approximately 0.0038 seconds (3.8 milliseconds). When comparing these two vibrating objects - the 1.0-meter length pendulum and the piano string which plays the middle C note - we would describe the piano string as vibrating relatively frequently and we would describe the pendulum as vibrating relatively infrequently. Observe that the description of the two objects uses the terms frequently and infrequently. The terms fast and slow are not used since physics types reserve the words fast and slow to refer to an object's speed. Here in this description we are referring to the frequency, not the speed. An object can be in periodic motion and have a low frequency and a high speed. As an example, consider the periodic motion of the moon in orbit about the earth. The moon moves very fast; its orbit is highly infrequent. It moves through space with a speed of about 1000 m/s - that's fast. Yet it makes a complete cycle about the earth once every 27.3 days (a period of about 2.4x10⁵ seconds) - that's infrequent.
Objects like the piano string that have a relatively short period (i.e., a low value for period) are said to have a high frequency. Frequency is another quantity that can be used to quantitatively describe the motion of an object is periodic motion. The frequency is defined as the number of complete cycles occurring per period of time. Since the standard metric unit of time is the second, frequency has units of cycles/second. The unit cycles/second is equivalent to the unit Hertz (abbreviated Hz). The unit Hertz is used in honor of Heinrich Rudolf Hertz, a 19th century physicist who expanded our understanding of the electromagnetic theory of light waves.
The concept and quantity frequency is best understood if you attach it to the everyday English meaning of the word. Frequency is a word we often use to describe how often something occurs. You might say that you frequently check your email or you frequently talk to a friend or you frequently wash your hands when working with chemicals. Used in this context, you mean that you do these activities often. To say that you frequently check your email means that you do it several times a day - you do it often. In physics, frequency is used with the same meaning - it indicates how often a repeated event occurs. High frequency events that are periodic occur often, with little time in between each occurrence - like the back and forth vibrations of the tines of a tuning fork. The vibrations are so frequent that they can't be seen with the naked eye. A 256-Hz tuning fork has tines that make 256 complete back and forth vibrations each second. At this frequency, it only takes the tines about 0.00391 seconds to complete one cycle. A 512-Hz tuning fork has an even higher frequency. Its vibrations occur more frequently; the time for a full cycle to be completed is 0.00195 seconds. In comparing these two tuning forks, it is obvious that the tuning fork with the highest frequency has the lowest period. The two quantities frequency and period are inversely related to each other. In fact, they are mathematical reciprocals of each other. The frequency is the reciprocal of the period and the period is the reciprocal of the frequency.
This reciprocal relationship is easy to understand. After all, the two quantities are conceptual reciprocals (a phrase I made up). Consider their definitions as restated below:
  • period = the time for one full cycle to complete itself; i.e., seconds/cycle
  • frequency = the number of cycles that are completed per time; i.e., cycles/second

Vibrational Motion

Vibrational Motion

Things wiggle. They do the back and forth. They vibrate; they shake; they oscillate. These phrases describe the motion of a variety of objects. They even describe the motion of matter at the atomic level. Even atoms wiggle - they do the back and forth. Wiggles, vibrations, and oscillations are an inseparable part of nature. In this chapter of The Physics Classroom Tutorial, we will make an effort to understand vibrational motion and its relationship to waves. An understanding of vibrations and waves is essential to understanding our physical world. Much of what we see and hear is only possible because of vibrations and waves. We see the world around us because of light waves. And we hear the world around us because of sound waves. If we can understand waves, then we will be able to understand the world of sight and sound.

Bobblehead Dolls - An Example of a Vibrating Object
To begin our ponderings of vibrations and waves, consider one of those crazy bobblehead dolls that you've likely seen at baseball stadiums or novelty shops. A bobblehead doll consists of an oversized replica of a person's head attached by a spring to a body and a stand. A light tap to the oversized head causes it to bobble. The head wiggles; it vibrates; it oscillates. When pushed or somehow disturbed, the head does the back and forth. The back and forth doesn't happen forever. Over time, the vibrations tend to die off and the bobblehead stops bobbing and finally assumes its usual resting position.
The bobblehead doll is a good illustration of many of the principles of vibrational motion. Think about how you would describe the back and forth motion of the oversized head of a bobblehead doll. What words would you use to describe such a motion? How does the motion of the bobblehead change over time? How does the motion of one bobblehead differ from the motion of another bobblehead? What quantities could you measure to describe the motion and so distinguish one motion from another motion? How would you explain the cause of such a motion? Why does the back and forth motion of the bobblehead finally stop? These are all questions worth pondering and answering if we are to understand vibrational motion. These are the questions we will attempt to answer in Section 1 of this chapter.

What Causes Objects to Vibrate?
Like any object that undergoes vibrational motion, the bobblehead has a resting position. The resting position is the position assumed by the bobblehead when it is not vibrating. The resting position is sometimes referred to as the equilibrium position. When an object is positioned at its equilibrium position, it is in a state of equilibrium. As discussed in the Newton's Law Chapter of the Tutorial, an object which is in a state of equilibrium is experiencing a balance of forces. All the individual forces - gravity, spring, etc. - are balanced or add up to an overall net force of 0 Newtons. When a bobblehead is at the equilibrium position, the forces on the bobblehead are balanced. The bobblehead will remain in this position until somehow disturbed from its equilibrium.
If a force is applied to the bobblehead, the equilibrium will be disturbed and the bobblehead will begin vibrating. We could use the phrase forced vibration to describe the force which sets the otherwise resting bobblehead into motion. In this case, the force is a short-lived, momentary force that begins the motion. The bobblehead does its back and forth, repeating the motion over and over. Each repetition of its back and forth motion is a little less vigorous than its previous repetition. If the head sways 3 cm to the right of its equilibrium position during the first repetition, it may only sway 2.5 cm to the right of its equilibrium position during the second repetition. And it may only sway 2.0 cm to the right of its equilibrium position during the third repetition. And so on. The extent of its displacement from the equilibrium position becomes less and less over time. Because the forced vibration that initiated the motion is a single instance of a short-lived, momentary force, the vibrations ultimately cease. The bobblehead is said to experience damping. Damping is the tendency of a vibrating object to lose or to dissipate its energy over time. The mechanical energy of the bobbing head is lost to other objects. Without a sustained forced vibration, the back and forth motion of the bobblehead eventually ceases as energy is dissipated to other objects. A sustained input of energy would be required to keep the back and forth motion going. After all, if the vibrating object naturally loses energy, then it must continuously be put back into the system through a forced vibration in order to sustain the vibration.

The Restoring Force
A vibrating bobblehead often does the back and forth a number of times. The vibrations repeat themselves over and over. As such, the bobblehead will move back to (and past) the equilibrium position every time it returns from its maximum displacement to the right or the left (or above or below). This begs a question - and perhaps one that you have been thinking of yourself as you've pondered the topic of vibration. If the forces acting upon the bobblehead are balanced when at the equilibrium position, then why does the bobblehead sway past this position? Why doesn't the bobblehead stop the first time it returns to the equilibrium position? The answer to this question can be found in Newton's first law of motion. Like any moving object, the motion of a vibrating object can be understood in light of Newton's laws. According to Newton's law of inertia, an object which is moving will continue its motion if the forces are balanced. Put another way, forces, when balanced, do not stop moving objects. So every instant in time that the bobblehead is at the equilibrium position, the momentary balance of forces will not stop the motion. The bobblehead keeps moving. It moves past the equilibrium position towards the opposite side of its swing. As the bobblehead is displaced past its equilibrium position, then a force capable of slowing it down and stopping it exists. This force that slows the bobblehead down as it moves away from its equilibrium position is known as a restoring force. The restoring force acts upon the vibrating object to move it back to its original equilibrium position.
Vibrational motion is often contrasted with translational motion. In translational motion, an object is permanently displaced. The initial force that is imparted to the object displaces it from its resting position and sets it into motion. Yet because there is no restoring force, the object continues the motion in its original direction. When an object vibrates, it doesn't move permanently out of position. The restoring force acts to slow it down, change its direction and force it back to its original equilibrium position. An object in translational motion is permanently displaced from its original position. But an object in vibrational motion wiggles about a fixed position - its original equilibrium position. Because of the restoring force, vibrating objects do the back and forth. We will explore the restoring force in more detail later in this lesson.

Other Vibrating Systems
As you know, bobblehead dolls are not the only objects that vibrate. It might be safe to say that all objects in one way or another can be forced to vibrate to some extent. The vibrations might not be large enough to be visible. Or the amount of damping might be so strong that the object scarcely completes a full cycle of vibration. But as long as a force persists to restore the object to its original position, a displacement from its resting position will result in a vibration. Even a large massive skyscraper is known to vibrate as winds push upon its structure. While held fixed in place at its foundation (we hope), the winds force the length of the structure out of position and the skyscraper is forced into vibration.
A pendulum is a classic example of an object that is considered to vibrate. A simple pendulum consists of a relatively massive object hung by a string from a fixed support. It typically hangs vertically in its equilibrium position. When the mass is displaced from equilibrium, it begins its back and forth vibration about its fixed equilibrium position. The motion is regular and repeating. In the next part of this lesson, we will describe such a regular and repeating motion as a periodic motion. Because of the regular nature of a pendulum's motion, many clocks, such as grandfather clocks, use a pendulum as part of its timing mechanism.
An inverted pendulum is another classic example of an object that undergoes vibrational motion. An inverted pendulum is simply a pendulum which has its fixed end located below the vibrating mass. An inverted pendulum can be made by attaching a mass (such as a tennis ball) to the top end of a dowel rod and then securing the bottom end of the dowel rod to a horizontal support. This is shown in the diagram below. A gentle force exerted upon the tennis ball will cause it to vibrate about a fixed, equilibrium position. The vibrating skyscraper can be thought of as a type of inverted pendulum. Tall trees are often displaced from their usual vertical orientation by strong winds. As the winds cease, the trees will vibrate back and forth about their fixed positions. Such trees can be thought of as acting as inverted pendula. Even the tines of a tuning fork can be considered a type of inverted pendulum
Another classic example of an object that undergoes vibrational motion is a mass on a spring. The animation at the right depicts a mass suspended from a spring. The mass hangs at a resting position. If the mass is pulled down, the spring is stretched. Once the mass is released, it begins to vibrate. It does the back and forth, vibrating about a fixed position. If the spring is rotated horizontally and the mass is placed upon a supporting surface, the same back and forth motion can be observed. Pulling the mass to the right of its resting position stretches the spring. When released, the mass is pulled back to the left, heading towards its resting position. After passing by its resting position, the spring begins to compress. The compressions of the coiled spring result in a restoring force that again pushes rightward on the leftward moving mass. The cycle continues as the mass vibrates back and forth about a fixed position. The springs inside of a bed mattress, the suspension systems of some cars, and bathroom scales all operated as a mass on a spring system.
In all the vibrating systems just mentioned, damping is clearly evident. The simple pendulum doesn't vibrate forever; its energy is gradually dissipated through air resistance and loss of energy to the support. The inverted pendulum consisting of a tennis ball mounted to the top of a dowel rod does not vibrate forever. Like the simple pendulum, the energy of the tennis ball is dissipated through air resistance and vibrations of the support. Frictional forces also cause the mass on a spring to lose its energy to the surroundings. In some instances, damping is a favored feature. Car suspension systems are intended to dissipate vibrational energy, preventing drivers and passengers from having to do the back and forth as they also do the down the road.

The Broken Pencil

A common classroom demonstration involves placing a pencil (or similar object) in an upright position in a round glass of water. The pencil is then slowly moved across the middle of the glass from a centered position to an off-center position. As the pencil is moved across the middle of the glass, an interesting phenomenon is observed. The position of the pencil under the water is shifted relative to the position of the pencil above the water - the pencil appears broken. Additionally, the pencil as observed through the water, appears fatter than the pencil as observed above the water. Finally, as the pencil is moved farther and farther towards the edge of the glass, the image of the pencil under the water finally disappears from sight.
Why is this phenomenon observed? Of course, the explanation of this phenomenon involves the refraction of light. But just how does the refraction of light cause the pencil to appear fatter and shifted to the side? The answer to this question is depicted in the animation below.
Anim'n of Light Rays

Kepler's Second Law

After studying a wealth of planetary data for the motion of the planets about the sun, Johannes Kepler proposed three laws of planetary motion. Kepler's second law states
An imaginary line joining a planet and the sun sweeps out an equal area of space in equal amounts of time.
The animation below depicts the elliptical orbit of a planet about the sun.
The dot pattern shows that as the planet is closest the sun, the planet is moving fastest and as the planet is farthest from the sun, it is moving slowest. Nonetheless, the imaginary line joining the center of the planet to the center of the sun sweeps out the same amount of area in each equal interval of time.

Energy Transformation for Downhill Skiing

Downhill skiing is a classic illustration of the relationship between work and energy. The skier begins at an elevated position, thus possessing a large quantity of potential energy (i.e., energy of vertical position). If starting from rest, the mechanical energy of the skier is entirely in the form of potential energy. As the skier begins the descent down the hill, potential energy is lost and kinetic energy (i.e., energy of motion) is gained. As the skier loses height (and thus loses potential energy), she gains speed (and thus gains kinetic energy). Once the skier reaches the bottom of the hill, her height reaches a value of 0 meters, indicating a total depletion of her potential energy. At this point, her speed and kinetic energy have reached a maximum. This energy state is maintained until the skier meets a section of unpacked snow and skids to a stop under the force of friction. The friction force, sometimes known as a dissipative force, does work upon the skier in order to decrease her total mechanical energy. Thus, as the force of friction acts over an increasing distance, the quantity of work increases and the mechanical energy of the skier is gradually dissipated. Ultimately, the skier runs out of energy and comes to a rest position. Work done by an external force (friction) has served to change the total mechanical energy of the skier.
This intricate relationship between work and mechanical energy is depicted in the animation below.
Along the inclined section of the run, the total mechanical energy of the skier is conserved provided that:
  • there is a negligible amount of dissipative forces (such as air resistance and surface friction), and
  • the skier does not utilize her poles to do work and thus contribute to her total amount of mechanical energy
Provided that these two requirements are met, there would be no external forces doing work upon the skier during the descent down the hill. The force of gravity and the normal forces would be the only active forces. While the normal force is an external force, it does not do work upon the skier since it acts at a right angle to the skier's displacement. In such situations where the angle between force and displacement is 90-degrees, the force does not do work upon the skier. Consequently, the force of gravity is the only force doing work on the skier and therefore the total mechanical energy of the skier is conserved. Potential energy is transformed into kinetic energy; and the potential energy lost equals the kinetic energy which is gained. Overall, the sum of the kinetic and potential energy remains a constant value.
The numerical values and accompanying bar chart in the animation above depicts these principles. During the descent down the hill, the height of the total mechanical energy (TME) bar remains a constant quantity, indicating the conservation of total mechanical energy. Furthermore, as the height of the potential energy (PE) bar decreases, the height of the kinetic energy (KE) bar increases.
Near the end of the run, the skier encounters the force of friction. This force acts in the direction opposite the displacement of the skier. The angle between the force and the displacement is 180 degrees. Using the equation for work (F*d*cosine 180 degrees), the amount of work can be calculated. The value calculated from the above equation is a negative number, indicating that the work done serves to remove energy from the object. This is why friction is sometimes referred to as a dissipative force. The amount of work which is done is equal to the loss of mechanical energy. The bar chart in the animation above depicts a work (W) bar with a negative height. As this bar becomes more negative, the height of the total mechanical energy (TME) bar becomes smaller. By the end of the animation, the work bar has reached a height of -8 units and the total mechanical energy bar has change its height from +8 units to 0 units. Thus, the change in height of the total mechanical energy bar (-8 units) equals the height of the work bar (-8 units).

Which Path Requires the Most Energy?

Suppose that a car traveled up three different roadways (each with varying incline angle or slope) from the base of a mountain to the summit of the mountain. Which path would require the most gasoline (or energy)? Would the steepest path (path AD) require the most gasoline or would the least steep path (path BD) require the most gasoline? Or would each path require the same amount of gasoline?
This situation can be simulated by use of a simple physics lab in which a force is applied to raise a cart up an incline at constant speed to the top of a seat. Three different incline angles could be used to represent the three different paths up the mountain. The seat top represents the summit of the mountain. And the amount of gasoline (or energy) required to ascend from the base of the mountain to the summit of the mountain would be represented by the amount of work done on the cart to raise it from the floor to the seat top. The amount of work done to raise the cart from the floor to the seat top is dependent upon the force applied to the cart and the displacement caused by this force. Typical results of such a physics lab are depicted in the animation below.
Observe in the animation that each path up to the seat top (representing the summit of the mountain) requires the same amount of work. The amount of work done by a force on any object is given by the equation
Work = F * d * cosine(Theta)
where F is the force, d is the displacement and Theta is the angle between the force and the displacement vector.
The least steep incline (30-degree incline angle) will require the least amount of force while the most steep incline will require the greatest amount of force. Yet, force is not the only variable affecting the amount of work done by the car in ascending to a certain elevation. Another variable is the displacement which is caused by this force. A look at the animation above reveals that the least steep incline would correspond to the largest displacement and the most steep incline would correspond to the smallest displacement. The final variable is Theta - the angle between the force and the displacement vector. Theta is 0-degrees in each situation. That is, the force is in the same direction as the displacement and thus makes a 0-degree angle with the displacement vector. So when the force is greatest (steep incline) the displacement is smallest and when the force is smallest (least steep incline) the displacement is largest. Subsequently, each path happens to require the same amount of work to elevate the object from the base to the same summit elevation.
Another perspective from which to analyze this situation is from the perspective of potential and kinetic energy and work. The work done by an external force (in this case, the force applied to the cart) changes the total mechanical energy of the object. In fact, the amount of work done by the applied force is equal to the total mechanical energy change of the object. The mechanical energy of the cart takes on two forms - kinetic energy and potential energy. In this situation, the cart was pulled at a constant speed from a low height to a high height. Since the speed was constant, the kinetic energy of the cart was not changed. Only the potential energy of the cart was changed. In each instance (30-degree, 45-degree, and 60-degree incline), the potential energy change of the cart was the same. The same cart was elevated from the same initial height to the same final height. If the potential energy change of each cart is the same, then the total mechanical energy change is the same for each cart. Finally, it can be reasoned that the work done on the cart must be the same for each path.

The Truck and Ladder

According to Newton's first law, an object in motion continues in motion with the same speed and in the same direction unless acted upon by an unbalanced force. It is the natural tendency of objects to keep on doing what they are doing. All objects resist changes in their state of motion. In the absence of an unbalanced force, an object in motion will maintain its state of motion. This is often called the law of inertia.
The law of inertia is most commonly experienced when riding in cars and trucks. In fact, the tendency of moving objects to continue in motion is a common cause of a variety of transportation accidents - of both small and large magnitudes. Consider for instance a ladder strapped to the top of a painting truck. As the truck moves down the road, the ladder moves with it. Being strapped tightly to the truck, the ladder shares the same state of motion as the truck. As the truck accelerates, the ladder accelerates with it; as the truck decelerates, the ladder decelerates with it; and as the truck maintains a constant speed, the ladder maintains a constant speed as well.
But what would happen if the ladder was negligently strapped to the truck in such a way that it was free to slide along the top of the truck? Or what would happen if the straps deteriorated over time and ultimately broke, thus allowing the ladder to slide along the top of the truck? Supposing either one of these scenarios were to occur, the ladder may no longer share the same state of motion as the truck. With the strap present, the forces exerted upon the car are also exerted upon the ladder. The ladder undergoes the same accelerated and decelerated motion that the truck experiences. Yet, once the strap is no longer present, the ladder is more likely to maintain its state of motion. The animation below depicts a possible scenario.
If the truck were to abruptly stop and the straps were no longer functioning, then the ladder in motion would continue in motion. Assuming a negligible amount of friction between the truck and the ladder, the ladder would slide off the top of the truck and be hurled into the air. Once it leaves the roof of the truck, it becomes a projectile and continues in projectile-like motion.

Image Formation for Plane Mirrors

To view an object in any type of mirror, a person must sight along a line at the image of the object. All persons capable of seeing the image must sight along a line of sight directed towards the precise image location. As a person sights in a mirror at the image of an object, there will be reflected rays of light coming from the mirror to that person's eye. The origin of this light ray is the object. A multitude of light rays from the object are incident on the mirror in a variety of directions. Yet as you sight at the image, only a small portion of these rays will reflect off the mirror and travel to your eye. To see an object in a mirror, you must sight at the image; and when you do reflected rays of light will travel from the mirror to your eye along your line of sight.
Not all people who are viewing the object in the mirror will sight along the same geometrical line of sight. The precise direction of the sight line depends on the location of the object, the location of the person, and the type of mirror. Yet all of the lines of sight, regardless of their direction, will pass through the image location. In fact, the image location is defined as the location where it seems to every observer as though light is coming from. Since all people see reflected rays of light as they sight at an image in the mirror, then the image location must be the intersection point of these reflected rays.
In the animation above, an object is positioned in front of a plane mirror. The plane mirror will produce an image of the object on the opposite side of the mirror. The distance from the object to the mirror equals the distance from the image to the mirror. Any person viewing this image must sight at this image location. The animation depicts the path of several rays of light from the object to the mirror. This light subsequently reflects such that observers could sight along a line of sight and view the image. Different people might sight from different locations; yet each person would sight at the same image location. As seen in the animation, the image location is the intersection point of all the reflected rays.

Image Formation for Plane Mirrors

The Law of Reflection

When a ray of light strikes a plane mirror, the light ray reflects off the mirror. Reflection involves a change in direction of the light ray. The convention used to express the direction of a light ray is to indicate the angle which the light ray makes with a normal line drawn to the surface of the mirror. The angle of incidence is the angle between this normal line and the incident ray; the angle of reflection is the angle between this normal line and the reflected ray. According to the law of reflection, the angle of incidence equals the angle of reflection. These concepts are illustrated in the animation below.

Definitions and Dimensions

Dimensioning

The purpose of dimensioning is to provide a clear and complete description of an object. A complete set of dimensions will permit only one interpretation needed to construct the part. Dimensioning should follow these guidelines.
  1. Accuracy: correct values must be given.
  2. Clearness: dimensions must be placed in appropriate positions.
  3. Completeness: nothing must be left out, and nothing duplicated.
  4. Readability: the appropriate line quality must be used for legibility.

The Basics: Definitions and Dimensions

The dimension line is a thin line, broken in the middle to allow the placement of the dimension value, with arrowheads at each end (figure 23).
Figure 23 - Dimensioned Drawing
 
An arrowhead is approximately 3 mm long and 1 mm wide. That is, the length is roughly three times the width. An extension line extends a line on the object to the dimension line. The first dimension line should be approximately 12 mm (0.6 in) from the object. Extension lines begin 1.5 mm from the object and extend 3 mm from the last dimension line.
A leader is a thin line used to connect a dimension with a particular area (figure 24).
Figure 24 - Example drawing with a leader
 
A leader may also be used to indicate a note or comment about a specific area. When there is limited space, a heavy black dot may be substituted for the arrows, as in figure 23. Also in this drawing, two holes are identical, allowing the "2x" notation to be used and the dimension to point to only one of the circles.

Where To Put Dimensions

The dimensions should be placed on the face that describes the feature most clearly. Examples of appropriate and inappropriate placing of dimensions are shown in figure 25.
Figure 25 - Example of appropriate and inappropriate dimensioning
 
In order to get the feel of what dimensioning is all about, we can start with a simple rectangular block. With this simple object, only three dimensions are needed to describe it completely (figure 26). There is little choice on where to put its dimensions.
Figure 26 - Simple Object
 
We have to make some choices when we dimension a block with a notch or cutout (figure 27). It is usually best to dimension from a common line or surface. This can be called the datum line of surface. This eliminates the addition of measurement or machining inaccuracies that would come from "chain" or "series" dimensioning. Notice how the dimensions originate on the datum surfaces. We chose one datum surface in figure 27, and another in figure 28. As long as we are consistent, it makes no difference. (We are just showing the top view).
Figure 27 - Surface datum example
 
Figure 28 - Surface datum example
 
In figure 29 we have shown a hole that we have chosen to dimension on the left side of the object. The Ø stands for "diameter".
Figure 29 - Exampled of a dimensioned hole

When the left side of the block is "radiuses" as in figure 30, we break our rule that we should not duplicate dimensions. The total length is known because the radius of the curve on the left side is given. Then, for clarity, we add the overall length of 60 and we note that it is a reference (REF) dimension. This means that it is not really required.
Figure 30 - Example of a directly dimensioned hole
 
Somewhere on the paper, usually the bottom, there should be placed information on what measuring system is being used (e.g. inches and millimeters) and also the scale of the drawing.
Figure 31 - Example of a directly dimensioned hole

This drawing is symmetric about the horizontal centerline. Centerlines (chain-dotted) are used for symmetric objects, and also for the center of circles and holes. We can dimension directly to the centerline, as in figure 31. In some cases this method can be clearer than just dimensioning between surfaces.